Desktop Analytics Overview
Desktop Analytics is a unique and illuminating software solution aimed at capturing data and generating insights about employee behavior on the desktop. Lack of visibility into employee productivity is a major challenge for global enterprises today.
The desktop forms a deep reservoir of rich and meaningful data with the potential to generate insights and measures around employee productivity scores, knowledge gaps and identification of inefficient processes. Desktop Analytics provides clear visibility into the daily desktop activities of front and back office employees.
Desktop Analytics provides the ability to monitor employee activities, such as application usage on the desktop. Two types of monitoring activities can be used in tandem to facilitate the analysis of employee productivity and efficiency: Process Monitoring and Application Monitoring. You may elect to perform one or both of these types of monitoring, depending on your specific requirements.
In addition, the Desktop Work Tracker enables an employee to manually insert processes into the system, from the employee's desktop. Desktop Work Tracker is intended for organization employees, providing them with full control of starting and stopping processes and identifying processes.
Process Monitoring Overview
Process monitoring is configured in Real-Time Designer, and is used to monitor how employees are performing their routine tasks on their desktops. The purpose of process monitoring in Real-Time Designer is to calculate process-related KPIs, such as the aggregated net handling time of a process instance. In this context, a process instance involves a single individual's handling of all the tasks defined for a given process.
For process monitoring, you configure the properties of the process itself and its associated tasks. As a result, you can monitor when a given process pauses and then resumes, as well as the state (started, paused, resumed or stopped) of any task within the process.
Monitoring the state of the currently active task enables you to measure user idle time within a process and account for it appropriately when determining overall process performance time. Idle time indicates when no mouse or keyboard action is detected for longer than a specified threshold. When a process becomes idle, it automatically pauses all of its active tasks. The process resumes when the next input event is received (keyboard or mouse). When a process is idle, the time that it is idle is not counted toward the process performance time. When the next mouse or keyboard action is detected, counting resumes. This mechanism provides the truest measurement of the actual overall process performance time.
Accumulated information for process monitoring activity enables you to determine the overall process performance lapse time per user. The Real-Time client monitors these processes and regularly sends timing data to the Real-Time Server and to the WFM (workforce management) server.
Sample Process Monitoring Scenario
This section walks you through a sample scenario that has already been defined in Real-Time Designer involving a simple, straightforward process typically performed by back office employees - email message handling. This section does not describe how to configure these definitions. For step-by-step details about how to configure this scenario in Real-Time Designer, see Defining Process Monitoring in Real-Time Designer.
The sample email message handling process consists of three discrete tasks, as follows:
-
reading the email
-
writing a response
-
sending a response
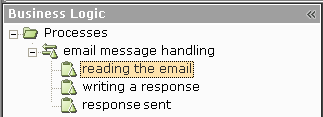
Configuration of these elements is performed using the Business Logic module tab in Real-Time Designer.
In this context, a process is similar to a workflow. However, a process does not trigger any actions. Rather, it logs the performance time of its component task instances.
In our scenario's email message handling process, the following activities must be performed in Real-Time Designer to configure the process and its associated tasks:
-
Map the Screen Elements to use for the process. Typically, this is performed by an integration expert. For more details, see Designer User Guide, Defining Screen Elements section.
-
Create the Business Entities to store the values of these Screen Elements or represent their events and functions. Typically, this is performed by an integration expert. For more details about defining Business Entities, see Designer User Guide, Business Entities section.
-
Define the properties of the process. You configure a process's properties directly in Real-Time Designer.
Every defined process must have both start and end triggers, in order to calculate the net handling time for that process. The email message handling process starts every time an email message is opened, which means that a new process instance begins counting each time a new email window is opened.
For a process, you configure triggers such as when the process starts and stops, and properties such as data collection, KPIs, its queue tag, the unique identifier of the process instance currently being executed, and when to consider the process as timed out or idle.
Define the properties of each task comprising the process. You configure a task's properties directly in Real-Time Designer.
Only one task can be active at any given time. If a task is activated and there is already another task that is active, then the previous task is stopped. Every process must contain at least one task.
Tasks can be performed in any order. Unlike a traditional Real-Time Designer workflow, tasks are not assumed to be performed in a predefined order (meaning, no explicit transitions between tasks are assumed). For more details about workflows, see Designer User Guide, Workflows section.
Two tabs are provided for configuring the properties for a task: the Start tab and the Pause tab.
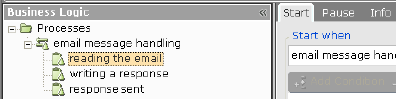
For a task, you configure properties such as when to start, stop, pause and resume the task.
Application Monitoring Overview
Application monitoring is used to monitor which application an employee is using at any given time on the desktop. Application monitoring is closely linked to process monitoring. In effect, application monitoring identifies what you want to monitor on the desktop, such as application usage, and then process monitoring translates that activity (the what) into discrete processes whose lapse time can be monitored in the Real-Time Solutions system. Together, application and process monitoring help you to improve employee productivity and efficiency
Application monitoring collects and logs events about the active application on the desktop, and determines whether these events correspond to web pages or Windows-based applications. Data is logged at the application or page level, which means that it is logged for each specific application window title or URL. For example, when an application event becomes active on a user's desktop, application monitoring identifies which screen of that application is active. If the active screen is an Internet Explorer page, then the URL designates the active screen or page. This information is collected on the Real-Time server for reporting purposes, and may optionally be transmitted to the WFM server, where it can be viewed and further analyzed.
When enabled, data is reported to the WFM server at regular intervals. This interval is configurable to include data for either the last 15 minutes or the last 30 minutes. Interval data is reported automatically, but may also be reported manually for a specific interval. The TotalView Report Resend Cron Expression parameter in the cron.properties file sets the frequency for the system to automatically scan posted data to check for dirty intervals (meaning those intervals that contain data that was not sent). When a dirty interval is detected, the system automatically resends its data so that the interval is clean. This means that it sends all the data for that interval again, which now includes any data that was never sent before.
Application monitoring only requires limited configuration in the Real-Time Solutions system to define the global configuration settings needed to implement this activity.
Integration with WFM
Desktop Analytics handles the monitoring actions performed on the desktop by defining the processes and tasks to be monitored, measuring their duration and then aggregating this information accordingly. This information is then optionally supplied to a WFM system. All further employee scheduling and forecasting actions and analysis are performed in the WFM system. The information provided by Desktop Analytics enables WFM to improve scheduling and forecasting by identifying the inefficiencies that need to be handled.