


Monitoring Databases
The Database tab in the Monitor window enables you to monitor the state of database connections and their data tables.
The Navigation pane of the window has a root branch for each database connection and sub-branches for each connection’s data tables.
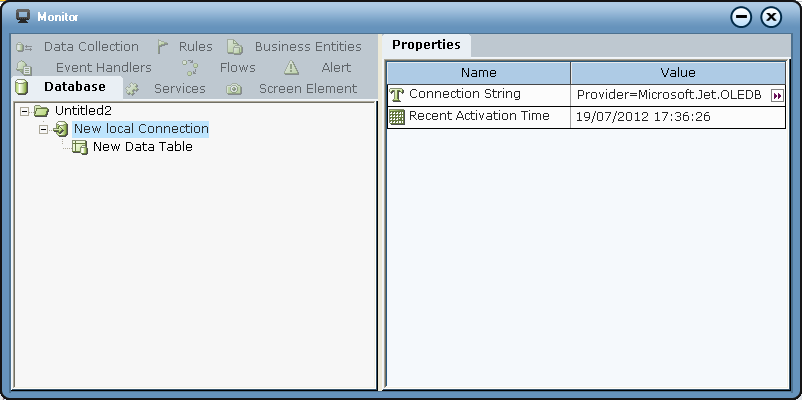
Select a database connection branch in the Navigation pane to display its properties in the pane on the right. The following properties are displayed for the selected connection:
Connection String: Shows the value of the connection string used to establish the database connection.
Recent Activation Time: The date and time when the database was recently accessed by the client.
Select a data table branch in the Navigation pane to display the query used to access the table in the pane on the right.
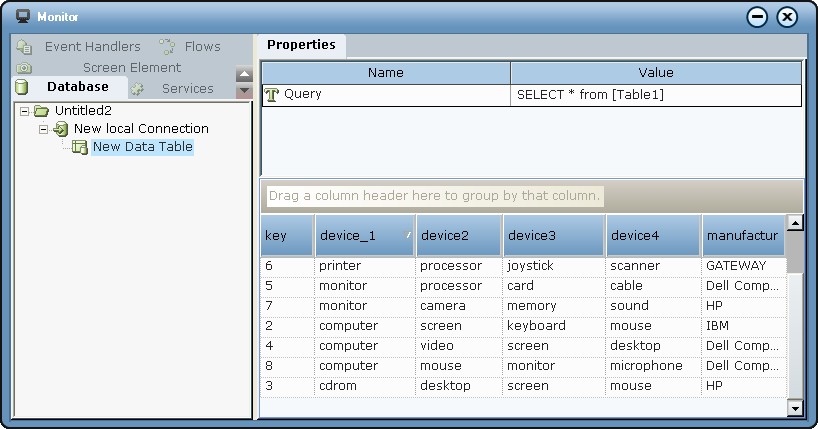
If the Monitor window is already open and the selected data table query has already been invoked, the data retrieved by the query is also displayed in the pane on the right.